The full review
What is Honeycomb?
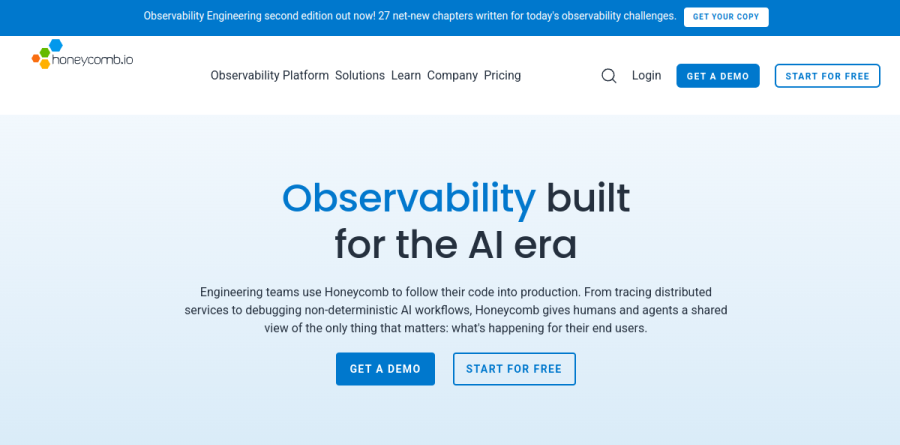
Honeycomb is an observability platform for engineers debugging systems they cannot fully predict in advance. The homepage frames it as observability built for the AI era, with the supporting idea that teams use Honeycomb to follow their code into production. Rather than splitting logs, metrics, and traces across three tools, Honeycomb ingests telemetry through OpenTelemetry and treats every attribute on an event as a dimension you can group by, filter, and graph.
The site's Observability Platform menu splits the product into four groups: Foundational Observability, AI Agent Observability, Agentic Intelligence, and Built-in Features. Foundational Observability covers Distributed Tracing, Log Analytics, Time Series Metrics, Frontend Observability, Telemetry Pipeline, and Private Cloud. Agentic Intelligence lists Canvas, MCP, MCP Skills, and Anomaly Detection, while AI Agent Observability lists Agent Timeline and LLM Observability, aimed at what the homepage calls debugging non-deterministic AI workflows.
Wide events and BubbleUp
What separates Honeycomb from a dashboard tool is cardinality. Because every field on an event stays queryable, the distributed tracing page notes that each field effectively becomes a custom metric you can query and graph, so build SHA, feature flag state, or model name become dimensions without prior registration. BubbleUp is the payoff: the homepage claims you can perform root cause analysis in under three minutes with BubbleUp. That suits investigations where the relevant dimension is still unknown.
Tracing requests through services and agents

Honeycomb pitches distributed tracing as rapid debugging, connecting your context inside a single tracing view. The examples given are a checkout flow, a microservice call chain, and an LLM agent reasoning through a dozen tool calls. Find the trace through filtering or a natural language query, delve into span details including fields, logs, and model calls, then lean on automated investigations to reduce single points of failure.
Agent Timeline carries that idea into AI workloads, putting every agent decision, tool call, and retry in the same view as the rest of your system. Canvas is the shared workspace where humans and agents compare findings.
SLOs, burn alerts, and Canvas investigations
Honeycomb's event-based SLOs calculate in real time to represent your customer experiences. The vendor argues that actionable Service Level Objectives catch business-impacting issues sooner while reducing alert fatigue, and the mechanics fit: burn alerts fire on error budget consumption and can trigger automated Canvas AI investigations, with notifications routed into Slack or a PagerDuty escalation.
Log Analytics and the Telemetry Pipeline

Log Analytics targets teams drowning in volume, promising a comb through billions of log lines in seconds with outlier analysis on raw data, and the vendor reports logs can be enriched with unlimited metadata at no additional cost. Sharing one platform with traces and metrics means an incident never forces a tool switch mid-investigation.
Telemetry Pipeline is the cost lever, and the pricing page meters it separately by volume, starting at $0.10 per GB. It offers an integrated builder with drag-and-drop components from pre-built templates, which the vendor marks as beta, plus sampling rules that retain important data while thinning the rest and instant rehydration of full-fidelity logs from S3.
How the plan tiers differ
The Free plan is usable rather than a trial countdown, bundling Distributed Tracing, BubbleUp, OpenTelemetry support, Canvas AI Copilot, Honeycomb MCP, and Agent Timeline under a small Trigger allowance and monthly event ceilings. Pro lifts those ceilings sharply and adds a larger Trigger count, SLOs, Single Sign-On, and Honeycomb Support. Enterprise brings governance: higher Trigger and SLO limits, Service Map, Query Data API, AWS PrivateLink, Private Cloud, and enterprise support for Refinery.
Who should choose Honeycomb
Honeycomb fits teams running microservices, event-driven backends, or LLM-backed features where failures hit a subset of traffic that nobody can identify in advance. If your services already emit OpenTelemetry, onboarding is short, and the Free plan leaves room to test BubbleUp and Canvas against production data before a purchase order exists.
It fits less well where the primary need is classic infrastructure monitoring, meaning host dashboards, uptime checks, and agent-based server metrics, because Honeycomb rewards investment in application instrumentation and assumes you will make it. A small team on a predictable monolith will likely find a simpler APM cheaper.
Strengths
- Genuinely generous free tier: 20M events/month with tracing, BubbleUp and OTel, no card or seat limits
- Best-in-class high-cardinality querying — no pre-defined indexes or cardinality caps
- Event-based pricing with unlimited seats and hosts on every tier, avoiding per-user/per-host bills
- Native OpenTelemetry ingestion plus fast BubbleUp anomaly analysis for quick root-cause
Watch out for
- Event-based billing climbs fast at high trace volumes unless you sample with Refinery
- Per-million-event overage rates are not published publicly — you must estimate volume or get a quote
- Metrics only reached GA in March 2026, so it's less mature than the tracing/logs core
- SSO, more triggers, longer retention and Service Map are gated to Pro/Enterprise
Key features
| Feature | What it does |
|---|
| BubbleUp | Automatically surfaces which dimensions differ in anomalous data to speed up root-cause analysis |
| High-cardinality querying | Query on any dimension (e.g. user ID, build ID) with no cardinality limits or pre-aggregation |
| OpenTelemetry-native | First-class OTel ingestion for vendor-neutral instrumentation and distributed tracing |
| SLOs & Triggers | Define service-level objectives with burn alerts; 2 SLOs on Pro, 100+ on Enterprise |
| Canvas AI Copilot & Honeycomb MCP | AI-assisted query building plus an MCP server for agent and LLM workflows |
| Refinery sampling | Tail-based sampling proxy to control event volume and keep costs predictable |
How Honeycomb compares
| Alternative | How it differs |
|---|
| Datadog | Broader all-in-one platform (infra, logs, RUM, security) but host- and feature-based pricing gets costly and limits cardinality |
| Grafana Cloud | Open-source LGTM stack, cheaper at scale but more assembly and self-management required |
| New Relic | Usage-based (per GB ingested + per user); strong APM but the per-user model can cost more for big teams |
Frequently asked questions
How much does Honeycomb cost?
The Free plan is $0 with up to 20M events per month. Pro starts at $150/month, including 50M events and scaling up to 750M events plus metric data points. Enterprise is custom-quoted (often $1,000+/month) with volume discounts. Billing is based on events and metric data points per month, and every tier includes unlimited seats.
Is Honeycomb free?
Yes. Honeycomb's Free plan costs $0 and includes up to 20M events and 100M metric data points per month, distributed tracing, BubbleUp, OpenTelemetry support, 2 triggers and the Canvas AI Copilot. There's no credit card or seat limit, so it's genuinely usable for small services — you only upgrade when you outgrow the monthly event volume.
What counts as an event in Honeycomb pricing?
An event is one unit of work. In tracing, each span counts as one event, so a 150-span trace equals 150 events. Only successfully ingested events count — sampled or rejected data does not. Tools like Refinery let you tail-sample to cut event volume, and metric data points are billed separately from events.
Honeycomb vs Datadog — which is cheaper?
It depends on your data shape. Honeycomb bills per event with unlimited seats and hosts, so high-cardinality, high-trace workloads are often cheaper than Datadog's host- and feature-based pricing. Datadog bundles more (infra, logs, RUM, security). For debugging complex distributed systems, Honeycomb usually wins on cost and query flexibility.
Does Honeycomb charge per user?
No. Every Honeycomb plan includes unlimited seats, unlimited querying and unlimited scale. You pay only for data volume — events per month plus metric data points — not per user or per host. That makes budgeting more predictable for large engineering teams compared with per-seat observability tools like New Relic.
Honeycomb ratings on other platforms
Independent user ratings from third-party review sites, linked here for transparency.
These are not our editorial score, are captured on the date shown, and may have changed since.