The full review
What is Datadog?
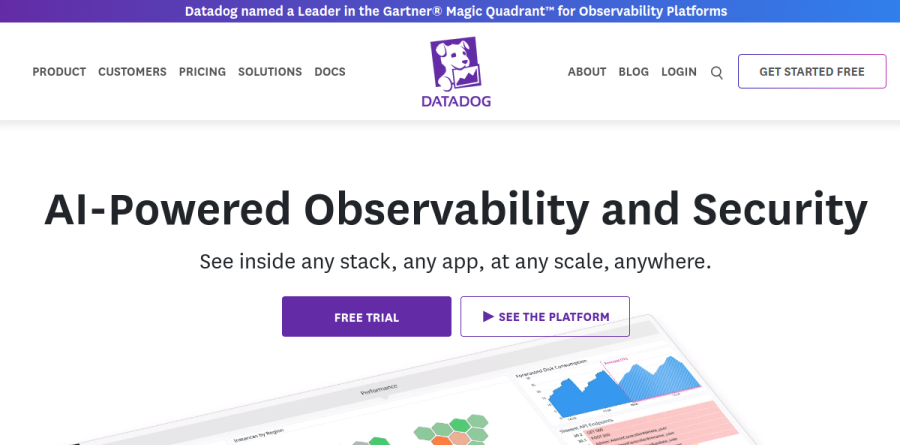
At its core, Datadog is a hosted observability and security platform that collects metrics, traces, and logs from servers, containers, cloud accounts, and application code, then presents them on shared dashboards and a common timeline. The homepage frames it as AI-Powered Observability and Security, with a promise of seeing inside any stack, any app, at any scale, anywhere. In practice an agent runs on your hosts, integrations pull telemetry from your providers, and everything lands in one queryable place.
The product navigation splits into Observability, Security, Digital Experience, Software Delivery, Service Management, AI, and Platform Capabilities, and each heading holds its own set of distinct products. Datadog is less a single tool than a large suite sold by module, which is the first thing to understand before evaluating it.
Infrastructure monitoring across a fleet
Infrastructure Monitoring is where most teams start. The infrastructure page leads with tag-based search and analytics, AIOps event correlation, and configuration change tracking, alongside vendor-backed integrations for Kubernetes and serverless platforms. Network Performance Monitoring and Cloud Cost Management sit alongside, so capacity and spend questions get answered in the same console. Datadog reports over 900 technology integrations, which is why onboarding a mixed estate rarely calls for custom exporters.
Application tracing and code-level detail

Datadog APM adds AI-powered code-level distributed tracing from browser and mobile applications to backend services and databases, aimed at observing, troubleshooting, and improving cloud-scale applications with all telemetry in context. Correlation is the workflow that earns its keep: a slow endpoint in a trace links to the host metrics beneath it, the logs it emitted, and the Real User Monitoring session that triggered it. Continuous Profiler diagnoses runtime and code inefficiencies in production through its timeline view, Error Tracking reduces noise by intelligently grouping errors into issues across your services, and Dynamic Instrumentation gives visibility into the execution time and resource consumption of every method, code line, and thread. Change tracking ties regressions back to deployments and feature flags, and OpenTelemetry is supported for teams that prefer vendor-neutral instrumentation.
Log management and pipeline control

Log Management is built around Logging without Limits, the idea that you ingest everything and decide separately what to index. Live Tail streams events as they arrive, Log Patterns and Pattern Inspector cluster noisy messages into readable groups, and Log Explorer plus Log Workspaces handle open-ended investigation. Flex Logs provides a cheaper tier for data you query rarely but must retain, while Archive Search reaches into cold storage during compliance work. Observability Pipelines processes and routes raw data before it lands, and Sensitive Data Scanner redacts secrets in flight. For security teams, the vendor advertises 800+ detection rules and says security coverage is boosted by aligning with the MITRE ATT&CK framework.
How the plans are structured
Datadog prices per module rather than per seat, and the shape matters more than any single figure. Infrastructure runs as Free, Pro, and Enterprise, with DevSecOps Pro and DevSecOps Enterprise folding security coverage into the same host-based rate. Tracing is sold at three levels, from the base APM plan up through APM Pro and APM Enterprise, billed per host and discounted when paired with an Infrastructure subscription. Log Management splits into Ingest, Standard Indexing, and the cheaper Flex Storage and Flex Logs Starter options. Annual commitments cost noticeably less than on-demand across the board, and a free trial is offered on every plan.
Who should choose Datadog
The teams best served here are engineering organizations running distributed systems in the cloud, where the alternative is stitching together separate metrics, tracing, log, and security tools and hoping the timestamps line up. Platform and SRE teams gain the most, because breadth is the point: one agent, one set of integrations, and traces correlated with logs, infrastructure metrics, database queries, and frontend telemetry in a single view. Regulated companies will value the Datadog Audit Trail, Sensitive Data Scanner, and the archive tiers. It is not ideal for a small team running a handful of servers on a fixed budget, where a lighter tool covers the need without module sprawl or a per-host meter that climbs with every deploy. Start on the Free tier, instrument one service properly, then expand deliberately.
Strengths
- Broadest suite in observability — 30+ integrated modules (infra, APM, logs, RUM, security) in one platform
- Polished UX with 1,000+ turnkey integrations and fast time-to-value
- Genuine free tier (up to 5 hosts) plus 14-day full-feature trials on paid products
- Strong Kubernetes, serverless, and cloud-native coverage
Watch out for
- Unpredictable bills — high-water-mark hourly host billing means autoscaling spikes inflate the whole month
- Costs scale faster than infrastructure; custom metrics, indexed logs, and retention add up quickly
- APM cannot be bought standalone at list — each APM host also needs an Infrastructure plan (~$46+/host)
- On-demand pricing runs 15-70% above annual commitments
Key features
| Feature | What it does |
|---|
| Infrastructure Monitoring | $15/host/mo (Pro, annual). 1,000+ integrations, 15-month metric retention, host maps and live process views. |
| APM & Continuous Profiler | $31/host/mo annual (requires Infra). Distributed tracing; Enterprise tier ($40) adds always-on code profiling. |
| Log Management | $0.10/GB ingest with decoupled indexing ($1.70/M events at 15-day) and Flex long-term storage ($0.05/M events). |
| Real User Monitoring | Browser and mobile session monitoring with Session Replay, from roughly $0.15 per 1,000 sessions (annual). |
| Synthetic Monitoring | Uptime and user-journey testing — about $5 per 10,000 API test runs and $12 per 1,000 browser test runs. |
| Security & 30+ products | DevSecOps bundles from $22/host/mo, plus CI Visibility, Database Monitoring, Feature Flags, and more. |
How Datadog compares
| Alternative | How it differs |
|---|
| New Relic | Prices mainly on data ingested (100 GB/mo free, then per-GB) plus per-user seats — often more predictable, fewer integrations. |
| Grafana Cloud | Cheaper, flexible open-source LGTM stack; more DIY setup and less turnkey cross-signal correlation. |
| Dynatrace | Comparable enterprise APM with strong AI (Davis) and per-hour host pricing; also enterprise-priced. |
Frequently asked questions
How much does Datadog cost?
Datadog is usage-based. Infrastructure monitoring is $15 per host per month (Pro, annual) or $18 on-demand; Enterprise is $23/$27. APM adds $31 per host per month (annual) and requires an Infrastructure plan. Log management is $0.10 per ingested GB plus $1.70 per million indexed events at 15-day retention. Real bills depend heavily on hosts, custom metrics, and log volume.
Is Datadog free?
Partly. Datadog has a permanent free tier for Infrastructure Monitoring covering up to 5 hosts with 1-day metric retention, core dashboards, and 100 custom metrics per host. Most paid products — APM, logs, RUM, Synthetics — also offer a 14-day full-feature trial. Beyond 5 hosts or 1-day retention, you move to the paid Pro or Enterprise plans.
Why is Datadog so expensive?
Datadog charges separately for 30+ products, and each dimension scales independently. Hosts are billed hourly on a high-water mark, so autoscaling spikes raise the whole month. Custom metrics, high-cardinality tags, indexed logs, retention, and per-run Synthetics all stack up. Teams often see bills grow faster than infrastructure — scaling 50 to 500 hosts can multiply costs well beyond 10x.
Datadog vs New Relic — which is cheaper?
New Relic prices mainly on data ingested (100 GB/month free, then roughly per-GB) plus per-user seats, which many teams find more predictable. Datadog charges per host — $15+ for infrastructure, $31 for APM — plus $0.10/GB for logs. For host-dense fleets Datadog can cost more, but its integrations and correlated UX are broader. Model both against your host count and data volume.
Datadog pricing explained — what drives the bill?
Three levers dominate. Hosts: infrastructure at $15-$23/host and APM at $31-$40/host, billed hourly at peak usage. Data: logs at $0.10/GB to ingest plus $1.70 per million events to index. Volume products: RUM around $0.15 per 1,000 sessions and Synthetics about $5 per 10,000 API runs. Annual commitments cut roughly 15-40% versus on-demand rates.
Datadog ratings on other platforms
Independent user ratings from third-party review sites, linked here for transparency.
These are not our editorial score, are captured on the date shown, and may have changed since.