The full review
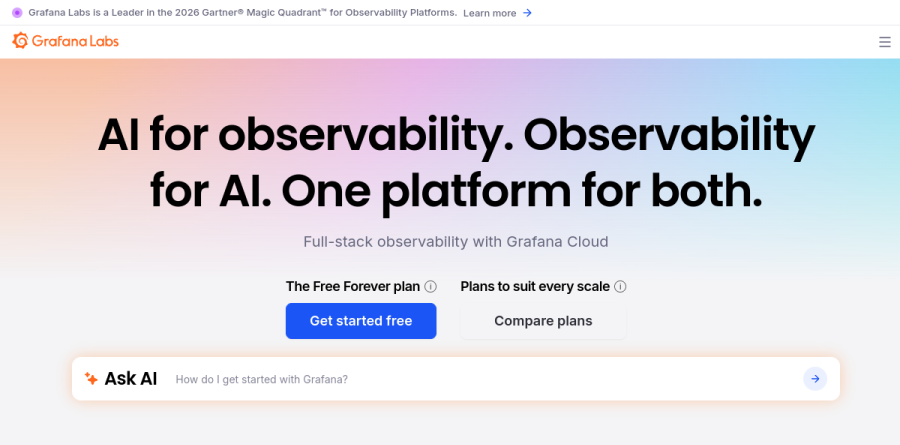
What is Grafana Cloud?
Grafana Cloud is the hosted version of the open source observability stack that Grafana Labs builds in public. Instead of operating Grafana, Prometheus, Loki and Tempo on your own infrastructure, you ship telemetry to Grafana Cloud and the vendor runs the storage layer, the query engines and the upgrades. Grafana Labs frames the product as full-stack observability delivered through a single view.
The service covers metrics, logs, traces and continuous profiles, then stacks product modules on top: Kubernetes Monitoring, Application Observability, Frontend Observability, Database Observability, Synthetic Monitoring, Incident Response and Management, and k6 performance testing. All of it lands in the same Grafana dashboards, so a spike in one signal sits a click away from the others.
Signals built on open standards

Each signal in Grafana Cloud maps to a project engineers already know. Grafana Cloud Metrics advertises full Prometheus compatibility, including remote-write, PromQL, alerting and a query builder, and Grafana Labs reports cardinality tested up to one billion active series. Grafana Cloud Logs runs on Loki and LogQL. Grafana Cloud Traces is powered by Tempo, stores spans in a columnar Parquet format, and ingests OpenTelemetry, Jaeger and Zipkin data for exploration with TraceQL.
The practical payoff is portability. The instrumentation and query languages your team already writes keep working, which makes both adoption and a future exit far less painful than agent-heavy proprietary suites.
Drilldown for engineers who avoid query languages
Grafana has invested heavily in queryless exploration, and it shows. Metrics Drilldown, Logs Drilldown and Traces Drilldown each layer a browsing interface over raw telemetry, so an on-call engineer who never learned TraceQL can still narrow a latency problem down to one service. Traces additionally derive RED metrics, covering request rate, errors and duration, without extra configuration, which means a freshly instrumented service arrives with useful charts rather than an empty dashboard.
Adaptive Telemetry and cost control

Observability bills tend to grow faster than the systems they watch, and Grafana Cloud tackles that directly through the Adaptive Telemetry family. Adaptive Metrics identifies and eliminates costly unused and partially used metrics, Adaptive Logs automatically filters out low-value logs, and Adaptive Traces uses tail sampling to identify and retain the valuable traces. The vendor reports telemetry cost reductions of up to 80 percent from this tooling.
Retention follows the plan. Free holds fourteen days of metrics, logs, traces and k6 results, Pro extends that window, and Enterprise negotiates custom retention alongside volume discounts.
AI assistance and incident response
Grafana Assistant sits inside the interface and answers questions against your own telemetry, while Investigations assembles context automatically once something breaks. Grafana Labs pairs both with a knowledge graph that enriches alerts using related resources. Incident Response and Management is listed among the Grafana Cloud products alongside these AI features. Agent Observability, promoted prominently on the homepage, targets teams running AI agents in production who need those calls traced like any other service.
Testing and real user visibility
Grafana Cloud reaches past backend signals. Grafana Cloud lists Performance and Load Testing with k6, Synthetic Monitoring, and Frontend Observability among its products, with RUM named as one of the solutions delivered in one unified experience.
Who should choose Grafana Cloud
Grafana Cloud suits teams already committed to Prometheus and OpenTelemetry who want the operational burden lifted without rewriting instrumentation. The Free plan is unusually workable for side projects and small teams, and Pro scales on usage rather than seats across most signals, which rewards disciplined telemetry hygiene. Platform and SRE groups that value open standards will find little to fight here.
It is a weaker fit for organizations that need one predictable monthly invoice, since usage-based billing spread across many meters takes real effort to forecast, and the Enterprise plan carries an annual commitment smaller companies will not reach.
Strengths
- Unusually generous free tier — 10k series, 50 GB logs/traces/profiles, no credit card required
- Built entirely on open standards (Prometheus, Loki, Tempo, OTel) so no proprietary lock-in on data
- Consolidates metrics, logs, traces, profiles, synthetics and k6 load testing in one platform
- Adaptive Telemetry and per-unit pay-as-you-go can be far cheaper than per-host competitors
Watch out for
- Usage-based billing across 7+ separate dimensions makes costs hard to predict; bills often land 2–5x initial estimates
- Free-tier stacks are hard-capped — data is refused once limits are hit, not just throttled
- High-cardinality metrics can inflate active-series counts and spike the bill quickly
- Enterprise-grade features and support require a $25,000/yr minimum spend commit
Key features
| Feature | What it does |
|---|
| Hosted Grafana | Fully managed Grafana dashboards and visualization with the AI Assistant, no infrastructure to run. |
| Managed Prometheus metrics | Grafana Mimir-backed metrics storage, PromQL-compatible, billed at $6.50 per 1k active series on Pro with 13-month retention. |
| Loki logs | Log aggregation with LogQL; Pro pricing splits into write, process and retain ($0.40/$0.05/$0.10 per GB). |
| Tempo traces | Distributed tracing with the same three-part per-GB pricing as logs, OpenTelemetry-native. |
| Pyroscope profiling | Continuous profiling included in the stack, 50 GB free per month with 14-day retention. |
| Synthetics & k6 | Synthetic API/browser checks (100k/10k free) plus k6 cloud load testing at $0.15 per virtual-user-hour. |
How Grafana Cloud compares
| Alternative | How it differs |
|---|
| Datadog | Broader all-in-one APM but far pricier, per-host base plus per-GB usage that scales aggressively. |
| New Relic | Consolidated usage-based model priced per-GB ingested plus per-user; simpler tiering, less open-source alignment. |
| Self-hosted Prometheus + Grafana OSS | Free open-source alternative, but you run, scale and secure the storage backends yourself. |
Frequently asked questions
How much does Grafana Cloud cost?
It starts free. The Pro plan adds a $19/month platform fee plus usage: $6.50 per 1,000 metrics active series, roughly $0.55 per GB for logs and traces (write, process and retain combined), and $8 per active user. Enterprise starts at a $25,000/year spend commit. Actual bills scale with telemetry volume.
Is Grafana Cloud free?
Yes. The free tier needs no credit card and includes 10,000 metrics active series, 50 GB each of logs, traces and profiles, 3 active users, 500 k6 virtual-user hours and 100k synthetic API checks, all with 14-day retention. Limits are hard caps — extra data is refused rather than billed until you upgrade.
Grafana Cloud vs Datadog: which is cheaper?
For teams standardizing on open-source telemetry, Grafana Cloud is usually cheaper because it bills per telemetry unit rather than per host. Datadog offers a broader all-in-one suite but its per-host base plus per-GB usage adds up fast. Grafana's free tier is also far more generous than Datadog's 14-day trial.
Grafana Cloud pricing explained: why is my bill unpredictable?
Grafana Cloud meters seven-plus dimensions independently — metrics series, log GB, trace GB, profiles, users, k6 and synthetics — each with its own rate. High-cardinality metrics inflate active-series counts, and logs are billed three ways (write, process, retain). Many teams see bills land two to five times higher than their first estimate.
What's the difference between Grafana OSS and Grafana Cloud?
Grafana OSS is the free, self-hosted open-source visualization tool you run and maintain yourself. Grafana Cloud is the fully managed SaaS bundling hosted Grafana with managed Prometheus (Mimir), Loki, Tempo and Pyroscope backends, support, and scaling handled by Grafana Labs. Cloud starts free; OSS is free but requires your own infrastructure.
Grafana Cloud ratings on other platforms
Independent user ratings from third-party review sites, linked here for transparency.
These are not our editorial score, are captured on the date shown, and may have changed since.